
Page 8 - IFR_Book_Sample-2020
P. 8
IFR-Chapter-2-V10-BAK_Basic Master Frame.qxd 12/19/2019 4:13 PM Page 8
2-8 Rod Machado’s Instrument Pilot’s Handbook
Maneuvering Speed Truth
As you know by now, an airplane flown at or below its maneuvering speed in turbulence, will stall before exceeding its
speed limit load factor (if you don’t know this then please read Postflight Briefing #2-5 in Rod Machado’s Private Pilot Handbook
b e l o w for a comprehensive and very different look at maneuvering speed). As a result, the airplane doesn’t suffer structural
damage. Yes, it may momentarily stall, but you probably never have to use standard stall recovery procedures as
the colored
a result. You can’t say the same about doing something as positive when a wing comes off. In strong turbu-
minimum. (For
lence, the only way to ensure that you won’t exceed the airplane’s structural limit is to fly a little below
your information,
maneuvering speed, perhaps by 10-15 knots. Since maneuvering speed is an indicated airspeed, the
the color coded stall
horizontal component of a gust (which can cause a 10-25 knot airspeed change in moderate turbu-
speed can also be the lence according to one British study) can temporarily increase your indicated airspeed many
minimum steady speed at knots over Va.
which the airplane is control-
Additionally, maneuvering speed is determined in a power-off condition by the manufac-
lable. Either definition is correct).
turer. Since you use power when you fly airplanes (you do, don’t you?), the result is that
Moving in a clockwise direction and the airplane stalls at a slightly slower speed. Why? Because some of that power is
following the white arc, we come to its applied vertically, in the direction of lift, thus reducing the total amount of lift the
high-speed end. This represents the maxi- wings need to produce for flight. Thus, the wings can fly at a slightly lower angle
mum airspeed at which you may fully extend of attack for a given power condition. In cruise flight your wings are now
the flaps or fly with them fully extended. Called Vfe slightly farther away from the angle of attack at which they will stall when
or velocity (V) of flaps (f) extended (e), flaps (unless a strong vertical gust is encountered. Those wings can now develop
approved by the POH) may not be used above this speed slightly more lift (perhaps more than they, or the airplane’s fixed
for fear of structural damage (and the prime directive of any weight components, can withstand) before they stall if and
pilot is to avoid bending any or all parts of the airplane). when they encounter a
strong enough verti-
Most things that are green are good (especially vegeta- cal gust.
bles, although my little nephew considers asparagus to be The
high speed
nothing more than spinach legs). That’s why the green arc
end of the
represents the normal operating range of the airplane.
The beginning of the green arc represents the power-off g r e e n a r c i s
stall speed or minimum steady flight speed in a specified called Vno or the All this adds up to one impor-
configuration. For the airplanes we typically fly, this con- maximum structural tant point. It’s safer to fly a
figuration occurs when the plane is at its maximum take- cruising speed. Since the little less than the manu-
off weight and the flaps and gear (if retractable) are up. green arc is the airplane’s facturer’s posted
This is called Vs1 or velocity (V) of stall (s) with every- normal operating range, think maneuvering speed
for your airplane
thing inside (1)—think of the 1 as the letter i representing of the top of the green arc as the when in
gear and flaps up or inside. With flaps up, gear up, and velocity (V) of normal (n) operation
strong tur-
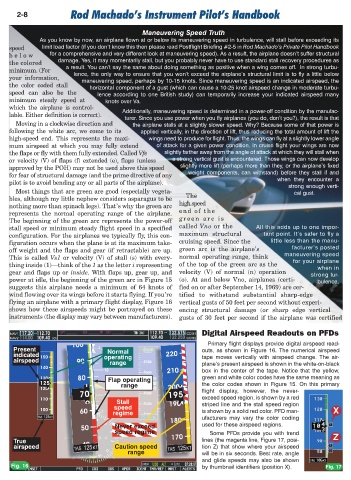
power at idle, the beginning of the green arc in Figure 15 (o). At and below Vno, airplanes (certi- bulence.
suggests this airplane needs a minimum of 64 knots of fied on or after September 14, 1969) are cer-
wind flowing over its wings before it starts flying. If you’re tified to withstand substantial sharp-edge
flying an airplane with a primary flight display, Figure 16 vertical gusts of 50 feet per second without experi-
shows how these airspeeds might be portrayed on these encing structural damage (or sharp edge vertical
instruments (the display may vary between manufacturers). gusts of 30 feet per second if the airplane was certified
Digital Airspeed Readouts on PFDs
Primary flight displays provide digital airspeed read-
Present Normal outs, as shown in Figure 16. The numerical airspeed
indicated operating tape moves vertically with airspeed change. The air-
airspeed range plane’s present airspeed is shown in the white-on-black
box in the center of the tape. Notice that the yellow,
green and white color codes have the same meaning as
Flap operating
range the color codes shown in Figure 15. On this primary
flight display, however, the never-
exceed speed region, is shown by a red
Stall striped line and the stall speed region
speed
regime is shown by a solid red color. PFD man- X
ufacturers may vary the color coding
Never exceed used for these airspeed regions.
speed regime Some PFDs provide you with trend
True lines (the magenta line, Figure 17, posi- Z
airspeed Caution speed tion Z) that show where your airspeed
range will be in six seconds. Best rate, angle
and glide speeds may also be shown
Fig. 16 by thumbnail identifiers (position X). Fig. 17